Views
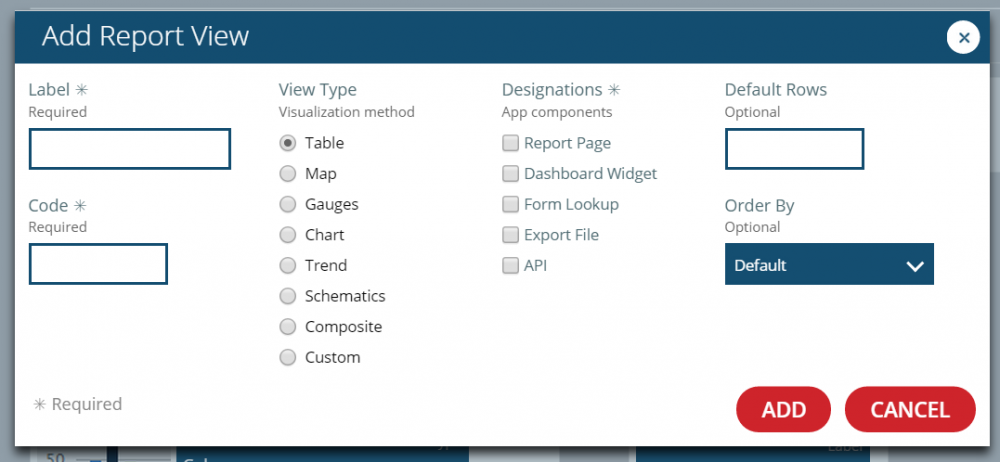
A is a data visualization method, a single table, chart, etc. displaying data on a report. A single report can contain multiple views, in order to display different subsets of the target fields of a query, or to display the exact same data in a different way. When viewing a report page, views appear as different tabs on the report that can be viewed one at a time. A user can add a new view to a data query as long as at least one target exists within the query. The "Add View" button in the Display As section of the Queries & Reports page brings up the following panel:

The most important attribute of a report view is its View Type, which controls how the view will render report data visually. Once the user creates a view, he or she cannot manually change its view type after the fact.
There are eight possible view types: Table, Chart, Map, Gauges, Trend, Schematics 3D Schematics and Custom. Each of these sub-types of views is covered in detail in the subsequent pages.
The Designations of a view are the places that view becomes accessible on the platform. The user can assign a view at least one of the six possible designations
- Report Page: The user can access the view on the View Report page; if there is more than one view of this designation in the report, these views appear as different tabs on the same page.
- Dashboard Widget: The user can add the view to the Dashboard as a widget.
- Form Lookup: The view can be linked to a form, where it can be used to look up data to automatically populate a form's fields, as described on the Form Sections page.
- Export File: The system can export the view to a document using the Generate Report routine action.
- API: The view can be accessed through an Broker API call to the platform or by using the Mobile Application.
- Trend Viewer: The view is accessible on the Trend Viewer page.
A view's type determines the designations that a user can assign to it. The following chart explains which designations are available to each type of view:
| View Type | Designation |
|---|---|
| Table | Report Page / Dashboard Widget / Form Lookup / Export File / API |
| Map | Report Page / Dashboard Widget / API |
| Gauges | Report Page / API |
| Chart | Report Page / Dashboard Widget |
| Trend | Trend Viewer |
| Schematics | Report Page |
| 3D Schematics | Report Page |
| Custom | Report Page |
There are a number of other attributes common to all types of views, in addition to these two. A view has a Label and Code to identify it to users and the system, respectively.
A view's code must be unique within the report, and while the label does not need to be unique, in most cases it is best to give a view a unique name as well, so as to avoid confusion.
The Default Rows attribute of a view controls how many query results are shown by default on the view, such as the number of rows shown in a table, or the number of data points on a line chart.
For some view types, such as tables, this attribute merely sets the starting number of results shown, and at runtime the user can adjust the number of rows he or she would like to see; for others, such as charts, there is no option to adjust the number of results included in the view at runtime, so there will only ever be the default-rows number of data points shown. This attribute as optional, and the system will default to a value of 10 if the user does not provide one.
The Order By attribute controls how the view sorts the results of the query before display. The user can select a field of one of the query targets, and the system will arrange the results of the query in descending order of the values of that field.
If the user selects a field, the Add Report View panel will also render the Order Directionattribute, which allows the user to select whether the view sorts the results in descending (default) or ascending (reverse) order.
When the user adds a new view, it appears as a block on the list of views in the Display As section.

In each block, an icon representing the type of view appears to the left of the view name, and icons representing each of that view's designations appear below. The page renders the view type icon of the selected view as a different color than the others. In the above example, the current selected view is the "Column" view, which is a Chart view with the "Report Page" designation.
A user can edit the basic fields listed above or delete the selected view by using the edit and delete buttons shown on the right of the screenshot.
Below the list of views, the Display As section allows users to configure the type-specific details of the selected view, and the contents of this section will be covered by the pages covering views of each type.